This short tutorial explains the usage of the GPU-accelerated HOOMD-blue particle simulation toolkit on our GPU-accelerated HPC cluster. Microway allows you to quickly test your codes on the latest high-performance systems – you are free to upload and run your own software, although we also provide a variety of pre-compiled applications with built-in GPU acceleration. Our GPU Test Drive Cluster is a useful resource for benchmarking the faster performance which can be achieved with NVIDIA Tesla GPUs.
This post demonstrate HOOMD-blue, which comes out of the Glotzer group at the University of Michigan. HOOMD blue supports a wide variety of integrators and potentials, as well as the capability to scale runs up to thousands of GPU compute processors. We’ll demonstrate one server with dual NVIDIA® Tesla® K40 GPUs delivering speedups over 13X!
Before continuing, please note that successful use of HOOMD-blue will require some familiarity with Python. However, you can reference their excellent Quick Start Tutorial. If you’re already familiar with a different software package, read through our list of pre-installed applications. There may be no need for you to learn a new tool.
Access a Tesla GPU-accelerated Compute Node
Getting started on our GPU system is fast and easy – complete this short form to sign up for HOOMD-blue benchmarking. We will send you an e-mail with a general list of commands when your request is accepted, but this post provides guidelines specific to HOOMD-blue tests.
First, you need SSH to access our GPU cluster. Don’t worry if you’re unfamiliar with SSH – we will send you step-by-step login instructions. Windows users have one extra step, but SSH is built-in on Linux and MacOS.
Run CPU and GPU-accelerated HOOMD-blue
Once you’re logged in, it’s easy to compare CPU and GPU performance: enter the HOOMD-blue directory and run the benchmark batch script which we have pre-written for you:
cd hoomd-blue
sbatch run-hoomd-on-TeslaK40.sh
Waiting for your HOOMD-blue job to finish
Our cluster uses SLURM to manage computational tasks. You should use the squeue command to check the status of your jobs. To watch as your job runs, use: watch squeue (hit CTRL+c to exit). Alternatively, the cluster can e-mail you when your job has finished if you update the HOOMD batch script file (although this must be done before submitting your job). Run:
nano run-hoomd-on-TeslaK40.sh
Within this file, add the following lines to the #SBATCH section (changing the e-mail address to your own):
#SBATCH --mail-user=[email protected]
#SBATCH --mail-type=END
If you would like to closely monitor the compute node which is executing your job, run squeue to check which compute node your job is running on. Log into that node via SSH and use one of the following tools to monitor the GPU and system status:
ssh node2
nvidia-smi
htop
(hit q to exit htop)
Check the speedup of HOOMD-blue on GPUs vs. CPUs
The results from the HOOMD-blue benchmark script will be placed in an output file named hoomd-K40.xxxx.output.log – below is a sample of the output running on CPUs:
======================================================
= Run CPU only lj_liquid_bmark_512K
======================================================
Average TPS: 21.90750
and with HOOMD-blue running on two GPUs (demonstrating a 13X speed-up):
======================================================
= Run Tesla_K40m GPU-accelerated lj_liquid_bmark_512K
======================================================
Average TPS: 290.27084
If you would like to examine the full execution sequence of a particular input, you will see that a log file has been created for each of the inputs (e.g., lj_liquid_bmark_512K.20_cpu_cores.output). If the HOOMD-blue job has any problems, the errors will be logged to the file hoomd-K40.xxxx.output.errors
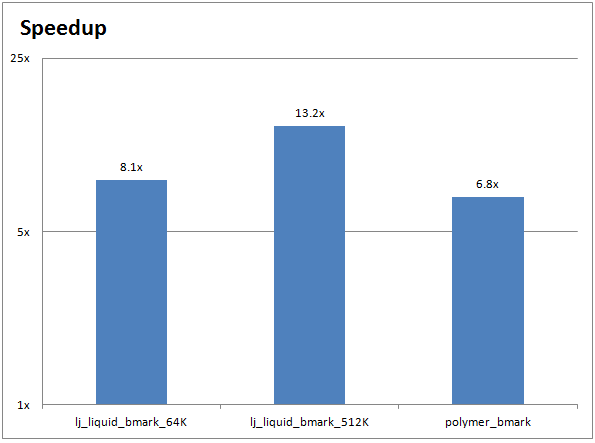
The chart below shows the performance improvements for a CPU-only HOOMD-blue run (on two 10-core Ivy Bridge Intel Xeon CPUs) compared to a GPU-accelerated HOOMD-blue run (on two NVIDIA Tesla K40 GPUs):
Running your own HOOMD-blue inputs on GPUs
If you’re comfortable with shell scripts you can write your own batch script from scratch, but we recommend using the run-hoomd-your-files.sh file as a template when you’d like to try your own simulations. For most HOOMD-blue runs, the batch script will only reference a single Python script as input (e.g., the lj_liquid_bmark_512K.hoomd script). Reference the HOOMD-blue Quick Start Tutorial.
Once your script is in place in your hoomd-blue/ directory, you’ll need to ensure that the batch script is referencing the correct .hoomd input file. The relevant lines of the run-hoomd-your-files.sh file are:
echo "==============================================================="
echo "= Run CPU-only"
echo "==============================================================="

srun --mpi=pmi2 hoomd input_file.hoomd --mode=cpu > hoomd_output__cpu_run.txt
grep "Average TPS:" hoomd_output__cpu_run.txt
and for execution on GPUs:
echo "==============================================================="
echo "= Run GPU-Accelerated"
echo "==============================================================="

srun --mpi=pmi2 -n $GPUS_PER_NODE hoomd input_file.hoomd > hoomd_output__gpu_run.txt
grep "Average TPS:" hoomd_output__gpu_run.txt
As shown above, both the CPU and GPU runs use the same input file (input_file.hoomd). They will each save their output to a separate text file (hoomd_output__cpu_run.txt and hoomd_output__gpu_run.txt). The final line of each section uses the grep tool to print the performance of that run. HOOMD-blue typically measures performance in millions of particle time steps per second (TPS), where a higher number indicates better performance.
Will GPU acceleration speed up your research?
With our pre-configured GPU cluster, running HOOMD-blue across an HPC cluster isn’t much more difficult than running it on your own workstation. This makes it easy to compare HOOMD-blue simulations running on CPUs and GPUs. If you’d like to give it a try, contact one of our experts or sign up for a GPU Test Drive today!
Citation for HOOMD-blue:
Joshua A. Anderson, Chris D. Lorenz, and Alex Travesset – ‘General Purpose Molecular Dynamics Fully Implemented on Graphics Processing Units’, Journal of Computational Physics 227 (2008) 5342-5359
https://glotzerlab.engin.umich.edu/hoomd-blue/
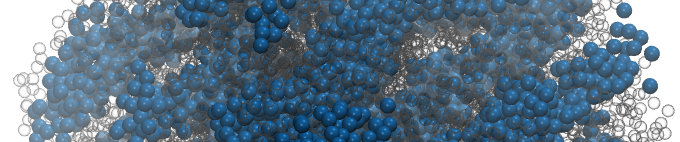
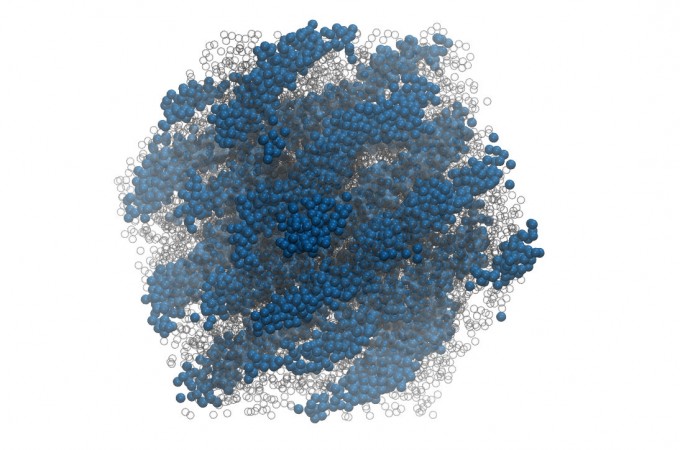
Featured Illustration:
“Micellar crystals in solution from molecular dynamics simulations”, J. Chem. Phys. 128, 184906 (2008); DOI:10.1063/1.2913522
https://doi.org/10.1063/1.2913522
Citation for VMD:
Humphrey, W., Dalke, A. and Schulten, K., “VMD – Visual Molecular Dynamics” J. Molec. Graphics 1996, 14.1, 33-38
https://www.ks.uiuc.edu/Research/vmd/