NVIDIA “Turing” Tesla T4 HPC Performance Benchmarks
connor.kenyon
·
Performance benchmarks are an insightful way to compare new products on the market. With so many GPUs available, it can be difficult to assess which are suitable to your needs. Various benchmarks provide information to compare performance on individual algorithms or operations. Since there are so many different algorithms to choose from, there is no shortage of benchmarking suites available.
For this comparison, the SHOC benchmark suite (https://github.com/vetter/shoc/) is used to compare the performance of the NVIDIA Tesla T4 with other GPUs commonly used for scientific computing: the NVIDIA Tesla P100 and Tesla V100.
The Scalable Heterogeneous Computing Benchmark Suite (SHOC) is a collection of benchmark programs testing the performance and stability of systems using computing devices with non-traditional architectures for general purpose computing, and the software used to program them. Its initial focus is on systems containing Graphics Processing Units (GPUs) and multi-core processors, and on the OpenCL programming standard. It can be used on clusters as well as individual hosts.
The SHOC benchmark suite includes options for many benchmarks relevant to a variety of scientific computations. Most of the benchmarks are provided in both single- and double-precision and with and without PCIE transfer consideration. This means that for each test there are up to four results for each benchmark. These benchmarks are organized into three levels and can be run individually or all together.
The Tesla P100 and V100 GPUs are well-established accelerators for HPC and AI workloads. They typically offer the highest performance, consume the most power (250~300W), and have the highest price tag (~$10k). The Tesla T4 is a new product based on the latest “Turing” architecture, delivering increased efficiency along with new features. However, it is not a replacement for the bigger/more power-hungry GPUs. Instead, it offers good performance while consuming far less power (70W) at a lower price (~$2.5k). You’ll want to use the right tool for the job, which will depend upon your workload(s). A summary of each Tesla GPU is shown below.
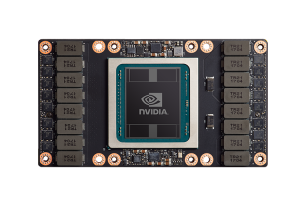
Tesla V100 – World’s Most Advanced Datacenter GPU, for AI & HPC
Integrated in Microway NumberSmasher and OpenPOWER GPU Servers & GPU Clusters
Specifications
Up to 7.8 TFLOPS double- and 15.7 TFLOPS single-precision floating-point performance
Up to 125 TensorTFLOPS of Deep Learning Performance
NVIDIA Volta™ GPU architecture
5120 CUDA cores, 620 Tensor Cores
16GB or 32GB of on-die HBM2 GPU memory
Memory bandwidth up to 900GB/s
NVIDIA NVLink™ or PCI-E x16 Gen3 interface to system
Available with enhanced NVLink interface, with 300GB/sec bi-directional bandwidth to the GPU
Passive heatsink only, suitable for specially-designed GPU servers
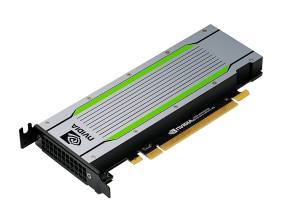
Tesla T4 – Price/performance for AI and Single Precision
Integrated in Microway NumberSmasher and Navion GPU Servers & GPU Clusters
Specifications
Up to 8.1 TFLOPS single-precision floating-point performance
Up to 65 TensorTFLOPS of Deep Learning Training Performance; 260 INT4 TOPS of Inference Performance
NVIDIA “Turing” TU104 graphics processing unit (GPU)
2560 CUDA cores, 320 Tensor Cores
16GB of GDDR6 GPU memory
Memory bandwidth up to 320GB/s
PCI-E x16 Gen3 interface to system
Passive heatsink only, suitable for specially-designed GPU servers
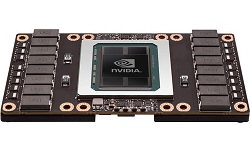
Tesla P100 – Strong Performance and Connectivity for HPC or AI
Integrated in Microway NumberSmasher and OpenPOWER GPU Servers & GPU Clusters
Specifications
Up to 5.3 TFLOPS double- and 10.6 TFLOPS single-precision floating-point performance
NVIDIA “Pascal” GP100 graphics processing unit (GPU)
3584 CUDA cores
12GB or 16GB of on-die HBM2 CoWoS GPU memory
Memory bandwidth up to 732GB/s
NVLink or PCI-E x16 Gen3 interface to system
Passive heatsink only, suitable for specially-designed GPU servers
In our testing, both single- and double-precision SHOC benchmarks were run, which allows us to make a direct comparison of the capabilities of each GPU. A few HPC-relevant benchmarks were selected to compare the T4 to the P100 and V100. Tesla P100 is based on the “Pascal” architecture, which provides standard CUDA cores. Tesla V100 features the “Volta” architecture, which introduced deep-learning specific TensorCores to complement CUDA cores. Tesla T4 has NVIDIA’s “Turing” architecture, which includes TensorCores and CUDA cores (weighted towards single-precision). This product was designed primarily with machine learning in mind, which results in higher single-precision performance and relatively low double-precision performance. Below, some of the commonly-used HPC benchmarks are compared side-by-side for the three GPUs.
Double Precision Results
GPU
Tesla T4
Tesla V100
Tesla P100
Max Flops (GFLOPS)
253.38
7072.86
4736.76
Fast Fourier Transform (GFLOPS)
132.60
1148.75
756.29
Matrix Multiplication (GFLOPS)
249.57
5920.01
4256.08
Molecular Dynamics (GFLOPS)
105.26
908.62
402.96
S3D (GFLOPS)
59.97
227.85
161.54
Single Precision Results
GPU
Tesla T4
Tesla V100
Tesla P100
Max Flops (GFLOPS)
8073.26
14016.50
9322.46
Fast Fourier Transform (GFLOPS)
660.05
2301.32
1510.49
Matrix Multiplication (GFLOPS)
3290.94
13480.40
8793.33
Molecular Dynamics (GFLOPS)
572.91
997.61
480.02
S3D (GFLOPS)
99.42
434.78
295.20
What Do These Results Mean?
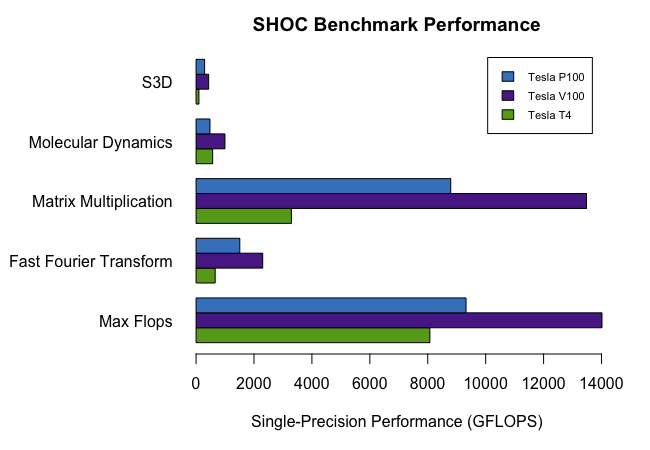
The single-precision results show Tesla T4 performing well for its size, though it falls short in double precision compared to the NVIDIA Tesla V100 and Tesla P100 GPUs. Applications that require double-precision accuracy are not suited to the Tesla T4. However, the single precision performance is impressive and bodes well for the performance of applications that are optimized for lower or mixed precision.
To explain the single-precision benchmarks shown above:
The Max Flops for the T4 are good compared to V100 and competitive with P100. Tesla T4 provides more than half as many FLOPS as V100 and more than 80% of P100.
The T4 shows impressive performance in the Molecular Dynamics benchmark (an n-body pairwise computation using the Lennard-Jones potential). It again offers more than half the performance of Tesla V100, while beating the Tesla P100.
In the Fast Fourier Transform (FFT) and Matrix Multiplication benchmarks, the performance of Tesla T4 is on par for both price/performance and power/performance (one fourth the performance of V100 for one fourth the price and one fourth the wattage). This reflects how the T4 will perform in a large number of HPC applications.
For S3D, the T4 falls behind by a few additional percent.
Looking at these results, it’s important to remember the context. Tesla T4 consumes only ~25% the wattage of the larger Tesla GPUs and costs only ~25% as much. It is also a physically smaller GPU that can be installed in a wider variety of servers and compute nodes. In that context, the Tesla T4 holds its own as a powerful option for a reasonable price when compared to the larger NVIDIA Tesla GPUs.
What to Expect from the NVIDIA Tesla T4
Cost-Effective Machine Learning
The T4 has substantial single/mixed precision machine learning focused performance, with a price tag significantly lower than larger Tesla GPUs. What the T4 lacks in double precision, it makes up for with impressive single-precision results. The single-precision performance available will strongly cater to the machine learning algorithms with potential to be applied to mixed precision. Future work will examine this aspect more closely, but Tesla T4 is expected to be of high interest for deep learning inference and to have specific use-cases for deep learning training.
Impressive Single-Precision HPC Performance
In the molecular dynamics benchmark, the T4 outperforms the Tesla P100 GPU. This is extremely impressive, and for those interested in single- or mixed-precision calculations involving similar algorithms, the T4 could provide an excellent solution. With some adapting algorithms, the T4 may be a strong contender for scientific applications that also want to utilize machine learning capabilities to analyze results or run a variety of different types of algorithms from both machine learning and scientific computing on an easily accessible GPU.
In addition to the outright lower price tag, the T4 also operates at 70 Watts, in comparison to the 250+ Watts required for the Tesla P100 / V100 GPUs. Running on one quarter of the power means that it is both cheaper to purchase and cheaper to operate.
Next Steps for leveraging Tesla T4
If it appears the new Tesla T4 will accelerate your workload, but you’d like to benchmark, please sign up to Test Drive for yourself. We also invite you to contact one of our experts to discuss your needs further. Our goal is to understand your requirements, provide guidance on best options, and see the project through to successful system/cluster deployment.
--- Welcome To The SHOC Benchmark Suite version 1.1.5 ---
Hostname: node9
Platform selection not specified, default to platform #0
Number of available platforms: 1
Number of available devices on platform 0 : 4
Device 0: 'Tesla T4'
Device 1: 'Tesla T4'
Device 2: 'Tesla T4'
Device 3: 'Tesla T4'
Device selection not specified: defaulting to device #0.
Using size class: 4

--- Starting Benchmarks ---
Running benchmark BusSpeedDownload
  result for bspeed_download: 12.3585 GB/sec
Running benchmark BusSpeedReadback
  result for bspeed_readback: 13.2077 GB/sec
Running benchmark MaxFlops
  result for maxspflops: 8073.2600 GFLOPS
  result for maxdpflops: 253.3760 GFLOPS
Running benchmark DeviceMemory
  result for gmem_readbw: 215.2640 GB/s
  result for gmem_readbw_strided: 109.2370 GB/s
  result for gmem_writebw: 201.0440 GB/s
  result for gmem_writebw_strided: 29.2783 GB/s
  result for lmem_readbw: 3435.8600 GB/s
  result for lmem_writebw: 3704.9400 GB/s
  result for tex_readbw: 884.0470 GB/sec
  Skipping non-cuda benchmark KernelCompile
  Skipping non-cuda benchmark QueueDelay
Running benchmark BFS
  result for bfs: 6.3894 GB/s
  result for bfs_pcie: 3.8521 GB/s
  result for bfs_teps: 344078000.0000 Edges/s
Running benchmark FFT
  result for fft_sp: 660.0520 GFLOPS
  result for fft_sp_pcie: 62.5926 GFLOPS
  result for ifft_sp: 657.7220 GFLOPS
  result for ifft_sp_pcie: 62.6273 GFLOPS
  result for fft_dp: 132.5970 GFLOPS
  result for fft_dp_pcie: 27.4628 GFLOPS
  result for ifft_dp: 125.4250 GFLOPS
  result for ifft_dp_pcie: 27.1584 GFLOPS
Running benchmark GEMM
  result for sgemm_n: 3290.9400 GFlops
  result for sgemm_t: 3287.4400 GFlops
  result for sgemm_n_pcie: 2377.5600 GFlops
  result for sgemm_t_pcie: 2375.7400 GFlops
  result for dgemm_n: 249.5690 GFlops
  result for dgemm_t: 249.6800 GFlops
  result for dgemm_n_pcie: 227.2710 GFlops
  result for dgemm_t_pcie: 227.3630 GFlops
Running benchmark MD
  result for md_sp_flops: 572.9100 GFLOPS
  result for md_sp_bw: 439.0600 GB/s
  result for md_sp_flops_pcie: 53.9088 GFLOPS
  result for md_sp_bw_pcie: 41.3140 GB/s
  result for md_dp_flops: 105.2590 GFLOPS
  result for md_dp_bw: 141.2860 GB/s
  result for md_dp_flops_pcie: 37.2010 GFLOPS
  result for md_dp_bw_pcie: 49.9335 GB/s
Running benchmark MD5Hash
  result for md5hash: 14.8551 GHash/s
Running benchmark NeuralNet
  result for nn_learning: BenchmarkError
  result for nn_learning_pcie: BenchmarkError
Running benchmark Reduction
  result for reduction: 225.9420 GB/s
  result for reduction_pcie: 11.6754 GB/s
  result for reduction_dp: 257.2570 GB/s
  result for reduction_dp_pcie: 11.7360 GB/s
Running benchmark Scan
  result for scan: 81.0464 GB/s
  result for scan_pcie: 5.8949 GB/s
  result for scan_dp: 62.2882 GB/s
  result for scan_dp_pcie: 5.7605 GB/s
Running benchmark Sort
  result for sort: 6.3951 GB/s
  result for sort_pcie: 3.1917 GB/s
Running benchmark Spmv
  result for spmv_csr_scalar_sp: 19.3042 Gflop/s
  result for spmv_csr_scalar_sp_pcie: 2.5486 Gflop/s
  result for spmv_csr_scalar_dp: 11.9228 Gflop/s
  result for spmv_csr_scalar_dp_pcie: 1.7080 Gflop/s
  result for spmv_csr_scalar_pad_sp: 24.5346 Gflop/s
  result for spmv_csr_scalar_pad_sp_pcie: 2.6437 Gflop/s
  result for spmv_csr_scalar_pad_dp: 14.4112 Gflop/s
  result for spmv_csr_scalar_pad_dp_pcie: 1.7501 Gflop/s
  result for spmv_csr_vector_sp: 51.6801 Gflop/s
  result for spmv_csr_vector_sp_pcie: 2.7829 Gflop/s
  result for spmv_csr_vector_dp: 35.7128 Gflop/s
  result for spmv_csr_vector_dp_pcie: 1.8895 Gflop/s
  result for spmv_csr_vector_pad_sp: 55.1641 Gflop/s
  result for spmv_csr_vector_pad_sp_pcie: 2.8127 Gflop/s
  result for spmv_csr_vector_pad_dp: 37.4158 Gflop/s
  result for spmv_csr_vector_pad_dp_pcie: 1.8914 Gflop/s
  result for spmv_ellpackr_sp: 37.6080 Gflop/s
  result for spmv_ellpackr_dp: 27.4393 Gflop/s
Running benchmark Stencil2D
  result for stencil: 218.0090 GFLOPS
  result for stencil_dp: 100.4440 GFLOPS
Running benchmark Triad
  result for triad_bw: 16.2555 GB/s
Running benchmark S3D
  result for s3d: 99.4160 GFLOPS
  result for s3d_pcie: 86.6513 GFLOPS
  result for s3d_dp: 56.9674 GFLOPS
  result for s3d_dp_pcie: 48.7782 GFLOPS
--- Welcome To The SHOC Benchmark Suite version 1.1.5 ---
Hostname: node6
Platform selection not specified, default to platform #0
Number of available platforms: 1
Number of available devices on platform 0 : 4
Device 0: 'Tesla V100-PCIE-32GB'
Device 1: 'Tesla V100-PCIE-32GB'
Device 2: 'Tesla V100-PCIE-32GB'
Device 3: 'Tesla V100-PCIE-32GB'
Specified 1 device IDs: 0
Using size class: 4

--- Starting Benchmarks ---
Running benchmark BusSpeedDownload
result for bspeed_download: 12.3182 GB/sec
Running benchmark BusSpeedReadback
result for bspeed_readback: 13.2066 GB/sec
Running benchmark MaxFlops
result for maxspflops: 14016.5000 GFLOPS
result for maxdpflops: 7072.8600 GFLOPS
Running benchmark DeviceMemory
result for gmem_readbw: 795.4980 GB/s
result for gmem_readbw_strided: 430.5780 GB/s
result for gmem_writebw: 710.4180 GB/s
result for gmem_writebw_strided: 54.3789 GB/s
result for lmem_readbw: 8535.5600 GB/s
result for lmem_writebw: 9191.3800 GB/s
result for tex_readbw: 1368.0900 GB/sec
Skipping non-cuda benchmark KernelCompile
Skipping non-cuda benchmark QueueDelay
Running benchmark BFS
result for bfs: 10.2526 GB/s
result for bfs_pcie: 4.9526 GB/s
result for bfs_teps: 489112000.0000 Edges/s
Running benchmark FFT
result for fft_sp: 2301.3200 GFLOPS
result for fft_sp_pcie: 66.9615 GFLOPS
result for ifft_sp: 2283.8400 GFLOPS
result for ifft_sp_pcie: 67.0689 GFLOPS
result for fft_dp: 1148.7500 GFLOPS
result for fft_dp_pcie: 33.4412 GFLOPS
result for ifft_dp: 1138.6500 GFLOPS
result for ifft_dp_pcie: 33.4938 GFLOPS
Running benchmark GEMM
result for sgemm_n: 13480.4000 GFlops
result for sgemm_t: 13685.9000 GFlops
result for sgemm_n_pcie: 5231.6300 GFlops
result for sgemm_t_pcie: 5262.3000 GFlops
result for dgemm_n: 5920.0100 GFlops
result for dgemm_t: 5606.4400 GFlops
result for dgemm_n_pcie: 1774.8200 GFlops
result for dgemm_t_pcie: 1745.5500 GFlops
Running benchmark MD
result for md_sp_flops: 997.6080 GFLOPS
result for md_sp_bw: 764.5360 GB/s
result for md_sp_flops_pcie: 55.5554 GFLOPS
result for md_sp_bw_pcie: 42.5760 GB/s
result for md_dp_flops: 908.6200 GFLOPS
result for md_dp_bw: 1219.6100 GB/s
result for md_dp_flops_pcie: 53.7409 GFLOPS
result for md_dp_bw_pcie: 72.1343 GB/s
Running benchmark MD5Hash
result for md5hash: 31.3448 GHash/s
Running benchmark NeuralNet
result for nn_learning: BenchmarkError
result for nn_learning_pcie: BenchmarkError
Running benchmark Reduction
result for reduction: 293.9380 GB/s
result for reduction_pcie: 11.7540 GB/s
result for reduction_dp: 506.6470 GB/s
result for reduction_dp_pcie: 11.9523 GB/s
Running benchmark Scan
result for scan: 182.4320 GB/s
result for scan_pcie: 6.1221 GB/s
result for scan_dp: 185.5270 GB/s
result for scan_dp_pcie: 6.1331 GB/s
Running benchmark Sort
result for sort: 19.9312 GB/s
result for sort_pcie: 4.8228 GB/s
Running benchmark Spmv
result for spmv_csr_scalar_sp: 65.9282 Gflop/s
result for spmv_csr_scalar_sp_pcie: 2.7467 Gflop/s
result for spmv_csr_scalar_dp: 46.7535 Gflop/s
result for spmv_csr_scalar_dp_pcie: 1.9000 Gflop/s
result for spmv_csr_scalar_pad_sp: 72.0344 Gflop/s
result for spmv_csr_scalar_pad_sp_pcie: 2.8377 Gflop/s
result for spmv_csr_scalar_pad_dp: 54.4875 Gflop/s
result for spmv_csr_scalar_pad_dp_pcie: 1.9227 Gflop/s
result for spmv_csr_vector_sp: 153.1620 Gflop/s
result for spmv_csr_vector_sp_pcie: 2.8131 Gflop/s
result for spmv_csr_vector_dp: 109.5760 Gflop/s
result for spmv_csr_vector_dp_pcie: 1.9441 Gflop/s
result for spmv_csr_vector_pad_sp: 156.8750 Gflop/s
result for spmv_csr_vector_pad_sp_pcie: 2.8987 Gflop/s
result for spmv_csr_vector_pad_dp: 115.0560 Gflop/s
result for spmv_csr_vector_pad_dp_pcie: 1.9587 Gflop/s
result for spmv_ellpackr_sp: 76.6566 Gflop/s
result for spmv_ellpackr_dp: 65.7927 Gflop/s
Running benchmark Stencil2D
result for stencil: 595.8100 GFLOPS
result for stencil_dp: 339.2710 GFLOPS
Running benchmark Triad
result for triad_bw: 16.4229 GB/s
Running benchmark S3D
result for s3d: 434.7830 GFLOPS
result for s3d_pcie: 263.8650 GFLOPS
result for s3d_dp: 227.8530 GFLOPS
result for s3d_dp_pcie: 136.3140 GFLOPS
--- Welcome To The SHOC Benchmark Suite version 1.1.5 ---
Hostname: node7
Platform selection not specified, default to platform #0
Number of available platforms: 1
Number of available devices on platform 0 : 4
Device 0: 'Tesla P100-PCIE-16GB'
Device 1: 'Tesla P100-PCIE-16GB'
Device 2: 'Tesla P100-PCIE-16GB'
Device 3: 'Tesla P100-PCIE-16GB'
Specified 1 device IDs: 0
Using size class: 4

--- Starting Benchmarks ---
Running benchmark BusSpeedDownload
result for bspeed_download: 12.3502 GB/sec
Running benchmark BusSpeedReadback
result for bspeed_readback: 13.2060 GB/sec
Running benchmark MaxFlops
result for maxspflops: 9322.4600 GFLOPS
result for maxdpflops: 4736.7600 GFLOPS
Running benchmark DeviceMemory
result for gmem_readbw: 574.4540 GB/s
result for gmem_readbw_strided: 98.2470 GB/s
result for gmem_writebw: 432.2270 GB/s
result for gmem_writebw_strided: 25.2659 GB/s
result for lmem_readbw: 4203.2000 GB/s
result for lmem_writebw: 5259.1000 GB/s
result for tex_readbw: 587.9750 GB/sec
Skipping non-cuda benchmark KernelCompile
Skipping non-cuda benchmark QueueDelay
Running benchmark BFS
result for bfs: 3.6904 GB/s
result for bfs_pcie: 2.6656 GB/s
result for bfs_teps: 208754000.0000 Edges/s
Running benchmark FFT
result for fft_sp: 1510.4900 GFLOPS
result for fft_sp_pcie: 66.1778 GFLOPS
result for ifft_sp: 1502.4700 GFLOPS
result for ifft_sp_pcie: 66.2629 GFLOPS
result for fft_dp: 756.2940 GFLOPS
result for fft_dp_pcie: 33.0865 GFLOPS
result for ifft_dp: 752.3340 GFLOPS
result for ifft_dp_pcie: 33.1221 GFLOPS
Running benchmark GEMM
result for sgemm_n: 8793.3300 GFlops
result for sgemm_t: 8882.6100 GFlops
result for sgemm_n_pcie: 4343.6700 GFlops
result for sgemm_t_pcie: 4365.3400 GFlops
result for dgemm_n: 4256.0800 GFlops
result for dgemm_t: 4389.7700 GFlops
result for dgemm_n_pcie: 1589.1300 GFlops
result for dgemm_t_pcie: 1607.4100 GFlops
Running benchmark MD
result for md_sp_flops: 480.0150 GFLOPS
result for md_sp_bw: 367.8690 GB/s
result for md_sp_flops_pcie: 52.8129 GFLOPS
result for md_sp_bw_pcie: 40.4741 GB/s
result for md_dp_flops: 402.9640 GFLOPS
result for md_dp_bw: 540.8830 GB/s
result for md_dp_flops_pcie: 50.0934 GFLOPS
result for md_dp_bw_pcie: 67.2385 GB/s
Running benchmark MD5Hash
result for md5hash: 14.6630 GHash/s
Running benchmark NeuralNet
result for nn_learning: BenchmarkError
result for nn_learning_pcie: BenchmarkError
Running benchmark Reduction
result for reduction: 257.3830 GB/s
result for reduction_pcie: 11.7287 GB/s
result for reduction_dp: 424.4240 GB/s
result for reduction_dp_pcie: 11.9433 GB/s
Running benchmark Scan
result for scan: 110.2530 GB/s
result for scan_pcie: 6.0040 GB/s
result for scan_dp: 131.8250 GB/s
result for scan_dp_pcie: 6.0633 GB/s
Running benchmark Sort
result for sort: 10.4056 GB/s
result for sort_pcie: 3.9523 GB/s
Running benchmark Spmv
result for spmv_csr_scalar_sp: 17.0055 Gflop/s
result for spmv_csr_scalar_sp_pcie: 2.4774 Gflop/s
result for spmv_csr_scalar_dp: 13.7115 Gflop/s
result for spmv_csr_scalar_dp_pcie: 1.7301 Gflop/s
result for spmv_csr_scalar_pad_sp: 21.3641 Gflop/s
result for spmv_csr_scalar_pad_sp_pcie: 2.6089 Gflop/s
result for spmv_csr_scalar_pad_dp: 16.0769 Gflop/s
result for spmv_csr_scalar_pad_dp_pcie: 1.7779 Gflop/s
result for spmv_csr_vector_sp: 58.5214 Gflop/s
result for spmv_csr_vector_sp_pcie: 2.7625 Gflop/s
result for spmv_csr_vector_dp: 45.8722 Gflop/s
result for spmv_csr_vector_dp_pcie: 1.8983 Gflop/s
result for spmv_csr_vector_pad_sp: 63.1210 Gflop/s
result for spmv_csr_vector_pad_sp_pcie: 2.8367 Gflop/s
result for spmv_csr_vector_pad_dp: 49.2344 Gflop/s
result for spmv_csr_vector_pad_dp_pcie: 1.9114 Gflop/s
result for spmv_ellpackr_sp: 54.0921 Gflop/s
result for spmv_ellpackr_dp: 37.1737 Gflop/s
Running benchmark Stencil2D
result for stencil: 424.1380 GFLOPS
result for stencil_dp: 263.4790 GFLOPS
Running benchmark Triad
result for triad_bw: 16.2500 GB/s
Running benchmark S3D
result for s3d: 295.1980 GFLOPS
result for s3d_pcie: 205.1260 GFLOPS
result for s3d_dp: 161.5440 GFLOPS
result for s3d_dp_pcie: 109.4630 GFLOPS
NVIDIA AI Blueprints are fast and accessible examples of complete workload pipelines. They’re designed to inspire end users to build their own custom pipelines. The NVIDIA Enterprise RAG Blueprint is an incredibly robust example of such work, and it shows how Retrieval Augmented Generation is a hot area of AI Deployment that allows you to…
We’re excited to share that Microway has officially achieved the prestigious NVIDIA DGX SuperPOD™ Specialization Partner Status with NVIDIA, to deliver AI factories. This designation recognizes Microway’s in-house expertise in architecting, building, testing, and delivering advanced AI deployments – and scaling some of the world’s most powerful AI infrastructure. Read more about the announcement NVIDIA DGX…
When NVIDIA launched the Ampere GPU architecture, they also launched their new flagship system for HPC and deep learning – the DGX 100. This system offers exceptional performance, but also new capabilities. We’ve seen immediate interest and have already shipped to some of the first adopters. Given our early access, we wanted to share a…