


This post is Topic #1 in our series Parallel Code: Maximizing your Performance Potential.
Regardless of the environment or architecture you are using, one thing is certain: you must properly manage the threads running in your application to optimize performance. This post will discuss how to get the most out of your threads in a CUDA application.
CUDA Threads
CUDA threads utilize block and thread IDs to determine what data to compute. Block IDs can be 1D or 2D. Thread IDs can be 1D, 2D, or 3D. Utilizing multidimensional threads and blocks greatly simplifies memory addressing when performing operations on multidimensional data (a very common occurrence in image processing, for example). You, the programmer, declare the size of the block (between 1 and 512 concurrent threads), the number of dimensions (1D, 2D, 3D) of the block, and the block dimensions in threads. In each block, all of the threads are capable of sharing data and synchronizing. The image below depicts the CUDA grid/block/thread structure.
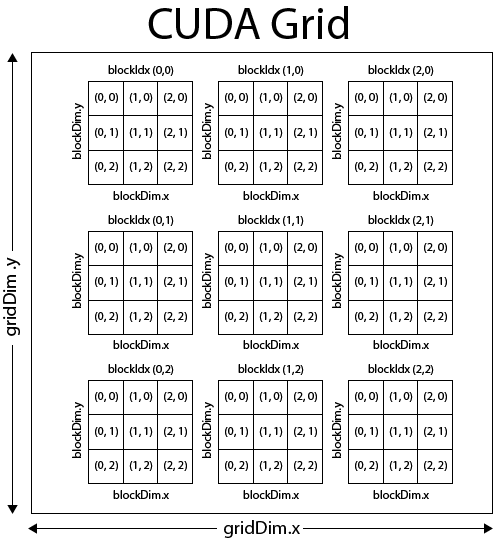
(courtesy 3dgep.com)
So, assuming you’ve got your kernel up and running, how do you properly manipulate the threads running in your application? For starters, declaring the proper block/grid size (and dimension) is paramount. The appropriate size for these parameters is hardware- and device-dependent and must be fiddled with through trial and error. There’s not really a “General Rule” for determining the values for these parameters outside of really knowing the data in your application and the limitations of your hardware. Let’s say for now, that your block and grid sizes are sufficient.
With appropriate block and grid sizes/dimensions, there are two keys to optimizing your application’s performance: thread communications and thread paths.
Thread Communications
When the threads (in the same block) in your application need to communicate or share data, there are two methods that CUDA provides: shared memory and __syncthreads(). The __syncthreads() command effectively creates a barrier in the code execution where all of the threads in a given block will wait until all of the threads in that block have reached the synchronization point. This is especially useful for ensuring that computation data is written to memory before other threads read it. Improper use of this command, however, can create deadlock conditions and cause your application to hang. Deadlocks are literally a show stopper since they will cause your application to stop dead in its tracks.
Maximizing the use of shared memory will be discussed in much greater detail in a later post. Effectively utilizing shared memory is an absolute necessity for a high-performance application. Shared memory is hundreds of times faster than global memory. A common method of scheduling computations on a device that maximizes the use of shared memory is, at a high level, relatively simple:
- Partition the data into smaller subsets that fit into shared memory
- Load the subset from global memory to shared memory
- Call
__syncthreads()to synchronize the threads - Perform the computation on the data subset via shared memory
- Copy the results from shared memory to global memory
Structuring your code in this fashion will pay great dividends.
Thread Paths
The other aspect of managing threads is controlling the paths of your threads. In nearly every application, it is almost impossible to structure code without branches (e.g. if/else conditions). Threads in the same block that execute different pieces of code (different execution paths) as a result of branch conditions are said to be divergent. When threads within the same block have different execution paths, they must be serialized. Since all threads in a block always run the same code, if any thread executes the code inside the IF condition (or if-then-else, for loops, etc), all of the threads in that same warp (a group of 32 threads) will go through that section of code. This occurs even if they are not actually executing (when the branch condition is not met)! If half of the threads in a given warp evaluate a branch condition as true, the utilization of the execution units is only 50%, meaning that half of the threads are effectively DOING NOTHING! The actual performance impact depends on the size and frequency of these divergent branch conditions.
Divergence can be avoided when a branch condition is a function of the thread ID. An example of code that would likely produce divergence:
if(threadIdx.x > 4) { //your code }
This divergence is a result of the branch granularity being less than the warp size. By making the branch granularity a whole multiple of the warp size (instead of less than the warp size), this divergence can be completely eliminated:
if(threadIdx.x/WARP_SIZE > 4) { //your code }
Optimizing in the Real World
I know what you’re thinking: “All of this is great information, Justin, but how can I check my code for deadlocks and divergent branches?” Easy – step through every line of code in the entire application with a fine toothed comb.
Well, that doesn’t sound easy. Fortunately, the NVIDIA CUDA profiler provides a very robust means for identifying these problems in your code. There are visual and text-based versions of the profiler – I’ll be discussing the text version. From the command line, the values of four environmental variables can be set:
CUDA_PROFILE(set to 1 or 0 to enable/disable the profiler)CUDA_PROFILE_LOG(set to the name of the log file that will contain the profiler results)CUDA_PROFILE_CSV(set to 1 or 0 to enable or disable a CSV version of the log)- Most importantly:
CUDA_PROFILE_CONFIG(specify the four event types that are to be profiled)
The CUDA profiler only supports four types of events being profiled at a time. Later posts will discuss the other event types of the profiler, but with regards to managing threads, a few event types are essential to profile:
branch(number of branch events taken by threads)divergent_branch(number of divergent branches within a warp)
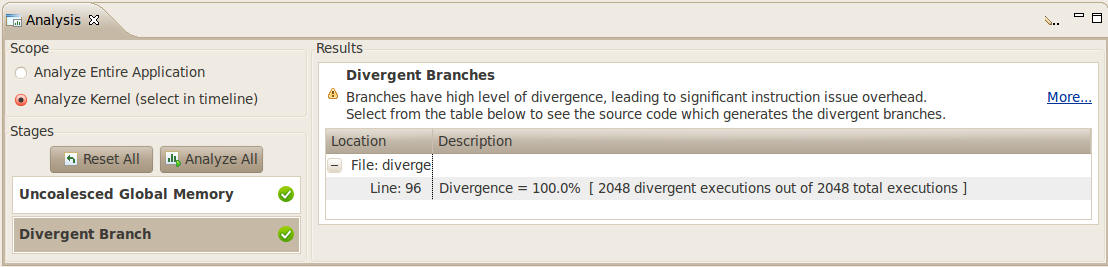
CUDA Visual Profiler showing divergent branches
With these set, the profiler will output the number of branches and divergent branches that are encountered when executing the application, which provides invaluable insight as to which portions of code are degrading performance. Using this information, you can tell if any of the branch conditions are causing threads to diverge. In addition to the events that were chosen to be profiled, the profiler can also output the total execution time on both the CPU and GPU for the application/kernel, which can be used to gauge performance when tweaking code. Additional functions of the CUDA profiler will be discussed throughout the next several posts.
More information on the NVIDIA CUDA profiler, including information about the visual profiler, can be found in the Profiler User’s Guide:
https://docs.nvidia.com/cuda/profiler-users-guide/index.html